
Lean Manufacturing System Metrics That Actually Improve Output
Lean metrics are not a scoreboard
A lean manufacturing system is often misunderstood as a collection of waste-reduction tools, and the same misunderstanding appears in the way factories measure performance. Many plants track dozens of indicators, yet output still stalls, schedules slip, and overtime rises. The problem is rarely a lack of data. It is that the chosen metrics do not help managers see where flow is breaking down.
In practice, lean metrics are not meant to make monthly reports look sophisticated. They are meant to trigger action on the shop floor and guide better decisions at production, maintenance, quality, and planning levels. If a metric cannot help a team identify a bottleneck, detect instability, or decide what to improve next, it may still be useful for finance or compliance, but it is not doing much for lean execution.
That is why the most effective lean measurement systems are usually smaller than people expect. They do not ignore complexity, but they reduce noise. A factory manager does not need twenty ways to say production is late. What matters is knowing whether the line is constrained by downtime, changeovers, scrap, poor scheduling, material shortages, or a mismatch between takt time and actual cycle time.
What a lean manufacturing system is really measuring
At its core, a lean manufacturing system tries to improve flow: material flow, information flow, decision flow, and ultimately customer order flow. So the best metrics are the ones that reveal how smoothly value moves through the operation. They tend to fall into a few practical categories: time, quality, equipment effectiveness, inventory behavior, and adherence to plan.
Time matters because delay is often the hidden form of waste. Quality matters because rework and scrap consume capacity that planners still assume is available. Equipment metrics matter because output targets collapse quickly when critical machines are unreliable. Inventory measures matter because excess stock can hide process instability for months. Plan adherence matters because a line can look busy while still failing to produce what the customer actually needs.
This is where many reporting systems drift away from lean thinking. They track utilization in isolation, reward every machine for staying busy, and end up producing local efficiency instead of plant-wide output. A process running at full speed is not automatically lean if it is building the wrong mix, creating queues, or forcing downstream rework.
The few metrics that usually matter most
There is no universal template that fits every factory, but several measurements consistently prove useful when the goal is better output rather than more reporting.
Throughput deserves special attention because it keeps the discussion honest. A line may show strong machine efficiency, acceptable labor utilization, and even stable batch output, yet customer shipments still lag. Throughput exposes whether the system is converting time and resources into finished, usable output. It shifts focus from activity to result.
Why OEE helps, and why it is often overused
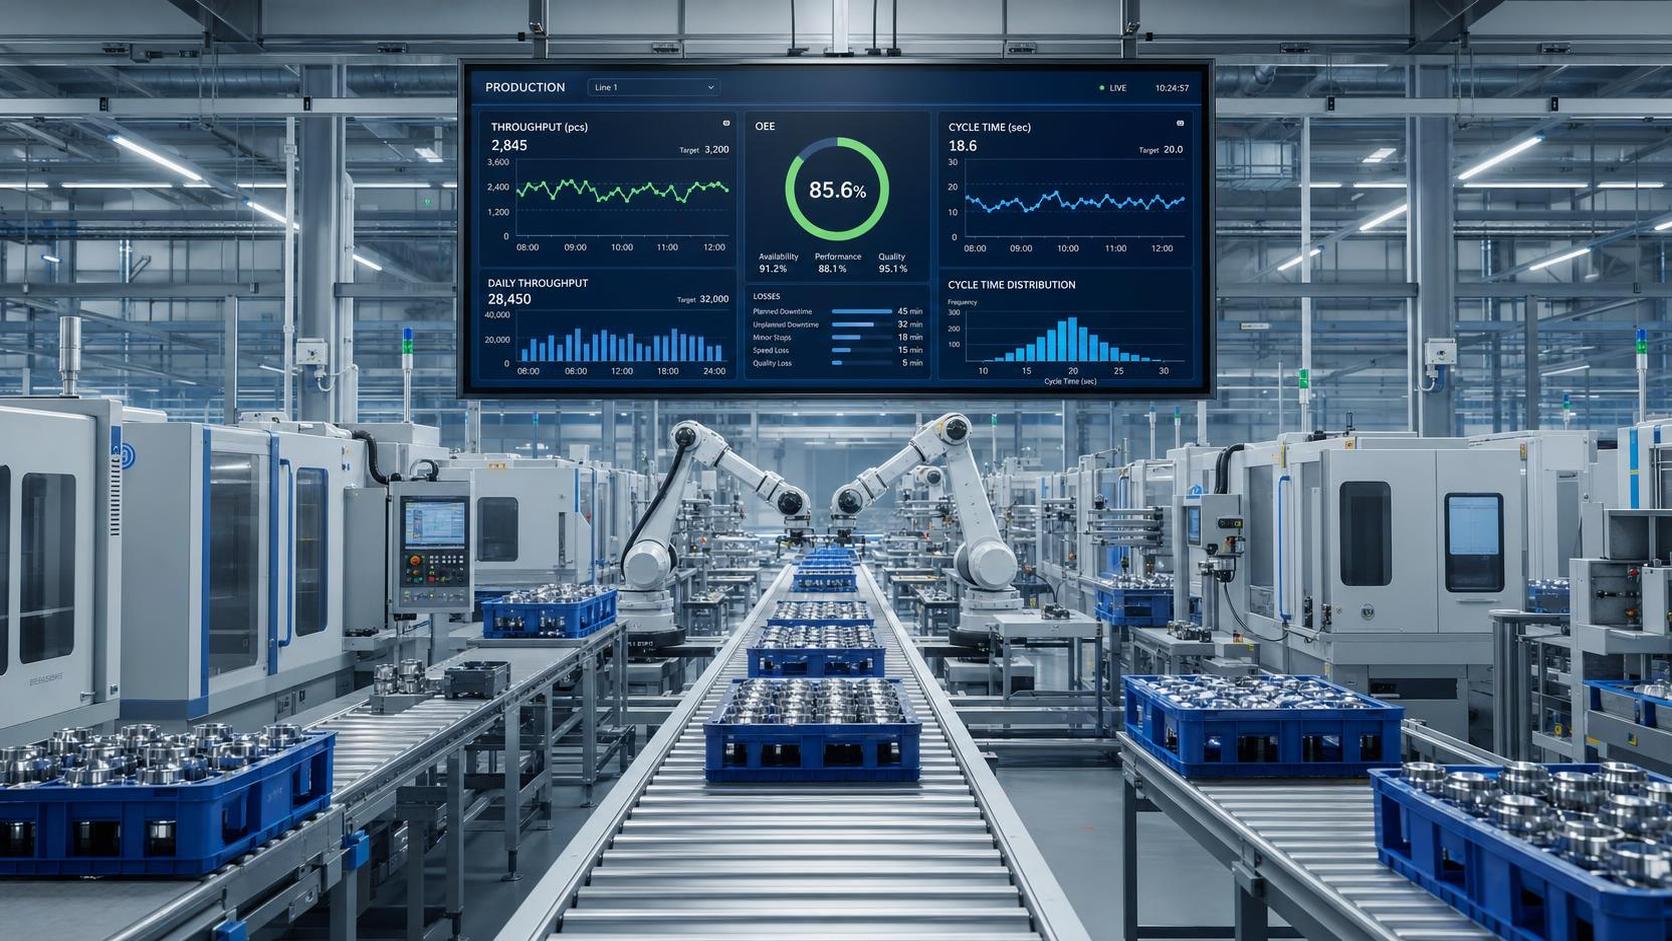
OEE, or Overall Equipment Effectiveness, remains one of the most recognized metrics in lean and TPM environments because it groups three common losses into one framework: availability loss from downtime, performance loss from slow running, and quality loss from defects. Used properly, it can show why a key asset is failing to deliver expected capacity.
The problem starts when OEE becomes a target detached from production context. A plant can raise OEE by running longer batches, reducing changeovers, and keeping one machine highly efficient, while increasing work-in-process and making the full value stream less responsive. That is not a contradiction. It simply shows that local asset optimization is not the same as lean system improvement.
For decision-makers, the more useful question is not “What is our OEE?” but “Which component of OEE is limiting output on the constraint process, and what is the business effect?” A packaging line with minor stops has a different problem from a machining center with long setups or a forming line generating frequent quality holds. The number alone cannot explain that.

Time-based metrics show where lean either works or fails
If one category of metrics consistently exposes weak lean systems, it is time. Lead time, cycle time, queue time, and changeover time all describe different parts of delay. When these are separated clearly, management can see whether the operation is slow because work is being processed too slowly or because it is spending too much time waiting.
That distinction matters. A process with short cycle times can still have poor lead time if jobs sit between steps for hours or days. In many factories, queue time is the larger issue, but it receives less attention because machines appear busy and production reports still show movement. Lean thinking forces a harder look at how long orders spend not being worked on.
Changeover time is also more strategic than it first appears. In high-mix environments, long setups push planners toward larger batches. Larger batches increase inventory, slow response to order changes, and make defects more expensive when they are discovered late. Reducing setup time is not just a maintenance or engineering issue. It changes the economic logic of the schedule.
Quality metrics should measure lost capacity, not just defects
Some plants report defect rates but miss the operational consequence. From a lean perspective, the useful question is how much capacity is being consumed by making parts incorrectly, sorting them, reworking them, or holding them for disposition. First pass yield is powerful because it captures whether the process creates conforming output without repair loops.
This becomes especially important when a factory believes it has “manageable” quality issues because final shipment quality remains acceptable. Final inspection can protect customers, but it can also hide process weakness. The line still spent labor, machine time, and materials on output that was not right the first time. For output improvement, that hidden capacity loss matters as much as the defect count itself.
A common mistake: measuring every department, but not the flow between them
Lean systems fail quietly when each function has its own dashboard and none of them describe the handoff points. Purchasing may report good material availability, production may report high labor utilization, warehousing may report clean inventory records, and maintenance may report completed work orders. Even so, the factory may still be missing shipments because information and materials are not arriving where they are needed at the right time.
This is why value-stream-level metrics are often more useful for senior management than isolated departmental measures. A constrained process, a recurring material shortage, or a planning-release delay can create system-wide output loss that no single department metric captures cleanly. The point of a lean manufacturing system is coordination around flow, not reporting excellence inside silos.
What decision-makers should look for in a good lean dashboard
A strong dashboard is not defined by visual complexity. It is defined by whether the numbers can explain yesterday’s output, today’s risk, and tomorrow’s improvement priority. That usually means a small set of linked indicators rather than a large library of independent KPIs.
A practical dashboard often includes:
- Throughput or completed good units against demand
- Constraint-area downtime and its top causes
- First pass yield or defect escape points
- Schedule attainment by product family or critical order group
- WIP at key buffer locations
- Changeover duration on high-impact equipment
The linkage matters more than the list. If schedule attainment falls, the dashboard should help reveal whether the cause is downtime, labor imbalance, setup loss, shortage, or scrap. If the indicators cannot be read together, managers end up with measurement without diagnosis.
Digitalization does not fix weak metric design
Manufacturers investing in MES, IIoT devices, machine connectivity, or factory analytics platforms often assume that better data collection will automatically strengthen lean execution. Sometimes it does. Just as often, it digitizes clutter. The software may provide minute-by-minute visibility, but if the business has not defined which losses matter most, teams simply get faster access to poorly prioritized information.
A useful rule is that automation should sharpen the signal, not multiply the noise. Before adding more dashboards, companies should decide which decisions need to happen faster, which constraints most affect output, and which measurements are trusted enough to drive intervention. Digital tools become valuable when they support that logic, especially in plants trying to connect production control, maintenance planning, and supply chain responsiveness.
The right question is whether a metric changes behavior
A metric belongs in a lean manufacturing system if it changes what people do. That may mean supervisors escalating a recurring stoppage sooner, planners reducing batch size after setup improvements, engineers targeting a quality loss point, or managers seeing that excess WIP is masking instability rather than protecting service.
For companies evaluating factory performance, especially across multiple sites or suppliers, the most credible metrics are the ones tied to flow, reliability, and first-time quality. They do not need to be numerous. They need to be operationally meaningful. A lean system becomes measurable when the numbers expose where output is being lost, and valuable when those numbers lead to disciplined corrective action.
That is the practical standard. Not whether the KPI set looks complete, but whether it helps the business produce the right output, at the right pace, with fewer hidden losses.
Related Intelligence