
Quality Management Basics: Which Metrics Best Reveal Process Stability?
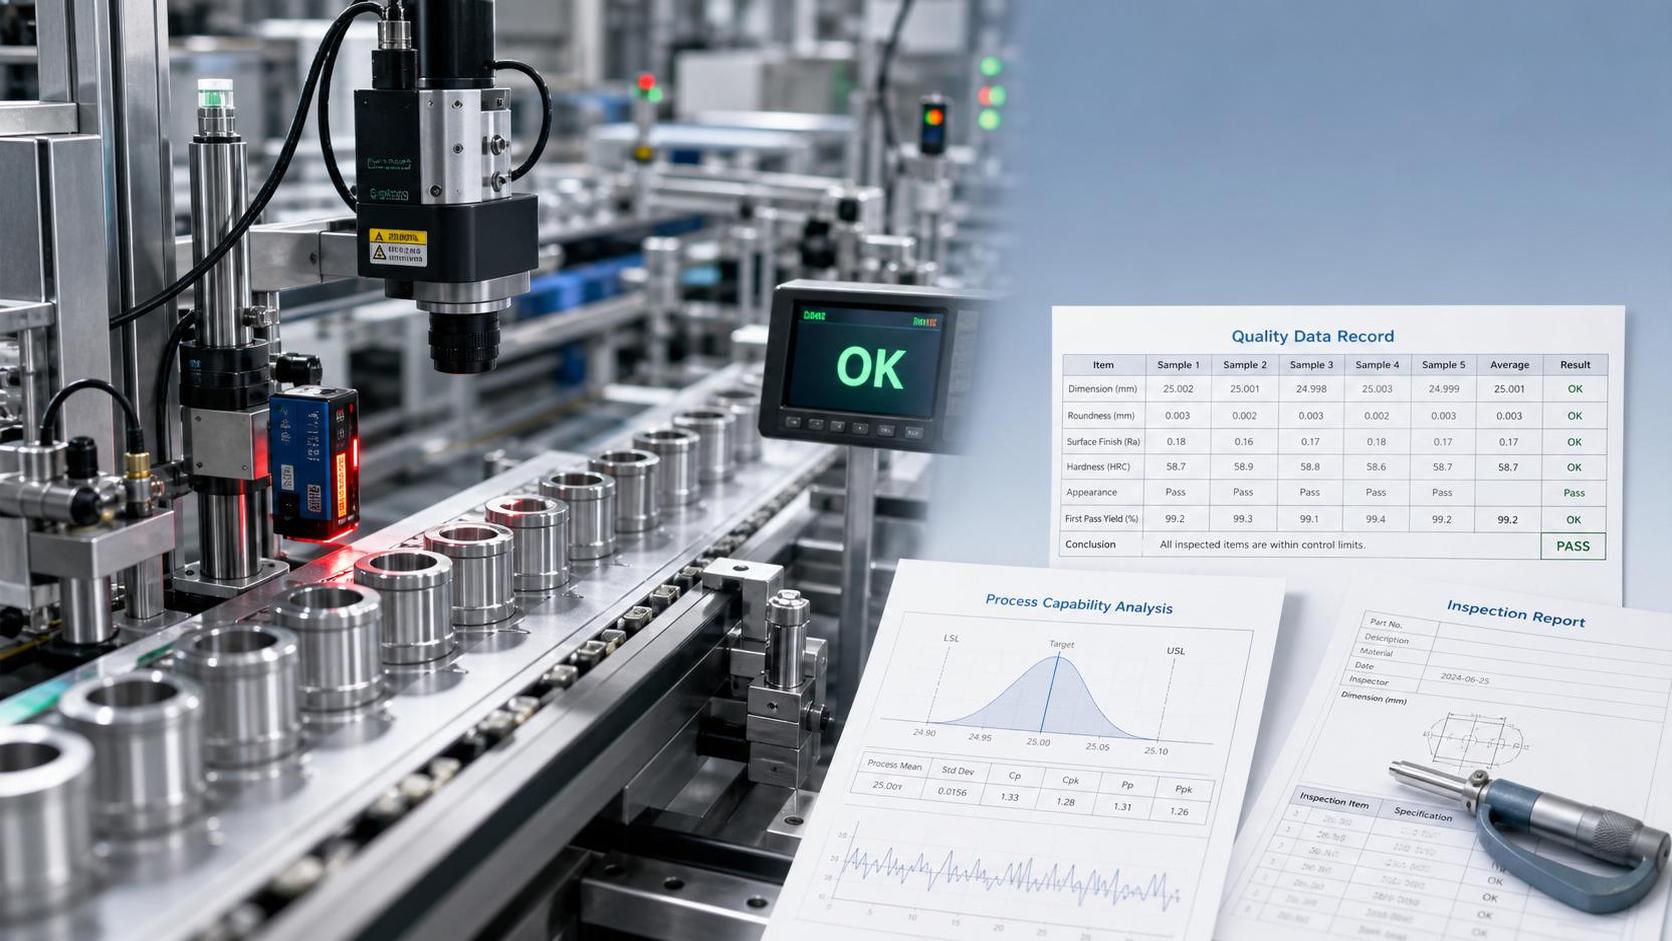
Why process stability matters more than a good output rate
In quality management, stable processes usually outperform fast but inconsistent ones.
A line can hit daily targets and still hide drift, rework, or safety exposure.
That is why process stability is a practical question, not a statistical luxury.
Across manufacturing, metals processing, warehousing, packaging, and industrial operations, the same issue appears.
If variation is not understood, quality management becomes reactive.
The result is late inspection, missed warning signs, and uneven decisions between shifts or suppliers.
A more useful approach is to watch a small set of metrics that reveal whether the process behaves predictably.
This is also why industrial information platforms such as Baozhen Industrial Intelligence Portal often connect quality data with operations, sourcing, and supply chain judgment.
Process stability affects delivery reliability, material use, compliance performance, and cross-border customer confidence.
Which metrics actually show whether a process is stable?
The best metrics do not simply show output.
They show consistency over time, the spread of variation, and how often the process breaks expected limits.
In basic quality management, five indicators usually give the clearest picture.
- Control chart behavior, including trends, runs, and points outside limits.
- Process capability, often expressed as Cp and Cpk.
- Defect rate by time period, not only monthly totals.
- First pass yield, which shows how often work succeeds without rework.
- Mean and range or standard deviation for critical process variables.
Control charts are often the earliest warning tool.
They reveal instability before defect counts rise enough to trigger management attention.
Capability metrics answer a different question.
They show whether a stable process can consistently meet specification limits.
A process may be stable but centered incorrectly.
That process is predictable, yet still weak.
Defect rate and first pass yield are easier for daily teams to understand.
Still, they should never be read alone.
A low defect rate can mask overinspection, sorting, or delayed failures.
A quick comparison helps separate the signals
Why is defect rate alone a weak measure in quality management?
Because defect rate is usually a lagging metric.
It tells you what escaped or what was found, not how the process behaved minute by minute.
In actual operations, instability often starts much earlier.
Tool wear, incoming material changes, calibration drift, or operator adjustments can shift the process first.
Defects may show up hours later.
This is especially relevant in metal fabrication, coating, machining, filling, and temperature-sensitive logistics.
A batch may pass final inspection but still carry unstable process history.
That creates warranty, traceability, or compliance risk later.
A stronger quality management routine combines lagging and leading metrics.
- Lagging metrics: defect rate, complaint rate, return rate, scrap cost.
- Leading metrics: control chart violations, parameter drift, alarm frequency, setup deviations.
When both move together, interpretation becomes more reliable.
When they do not, the reporting system itself may need review.
How do Cp and Cpk fit into real process stability decisions?
These metrics are useful, but they are often misunderstood.
Cp measures potential capability if the process is centered.
Cpk measures actual capability with centering included.
In simple terms, Cp asks how wide the tolerance is compared with process spread.
Cpk asks whether that spread sits in the right place.
The important caution is this.
Capability metrics make sense only after stability is confirmed.
If the process is bouncing due to special causes, Cp and Cpk can look precise but mislead decisions.
That mistake appears in supplier audits, new line launches, and transfer production.
A short data window may produce acceptable numbers while the process is still settling.
A practical rule is to review three layers together.
- Is the control chart stable over enough cycles?
- Are measurement systems repeatable and trusted?
- Do Cp and Cpk support the customer or internal tolerance target?
Only after those questions are answered does capability become actionable.
What usually causes a stable process to become unstable?
In most cases, instability does not come from one dramatic event.
It builds through small shifts that nobody owns clearly.
Quality management works better when these sources are grouped by origin.
This wider view matters in global supply chains.
A stable internal process can still become unstable when materials, transport conditions, or outsourced steps change.
That is why quality management should connect with sourcing and logistics data, not stay inside final inspection reports.
If resources are limited, where should monitoring start?
Start with the process characteristics that create the highest business impact when they drift.
That usually means critical-to-quality dimensions, safety-sensitive controls, and parameters tied to customer complaints or rework cost.
There is no need to measure everything at once.
A narrow but disciplined system is more useful than a broad reporting sheet nobody trusts.
A reasonable starting sequence looks like this.
- Identify three to five critical variables linked to defects or safety events.
- Confirm the measurement method is consistent.
- Track data by shift, machine, batch, or supplier.
- Add a simple control chart and reaction rule.
- Review first pass yield and defect patterns weekly.
In practice, the best quality management dashboards are not always the most complex.
They are the ones that help teams decide when to intervene, escalate, or hold production.
For organizations comparing plants, suppliers, or product families, industry-focused resources can help benchmark what to monitor first.
That is where a portal covering manufacturing, metals, trade, and supply chain analysis becomes relevant.
Useful interpretation often sits between technical data and operating context.
What is the most practical takeaway for better quality management?
Process stability is best revealed by patterns, not isolated scores.
If one metric must lead, begin with control chart behavior.
Then support it with process capability, first pass yield, and time-based defect trends.
That combination gives a fuller view of control, capability, and hidden loss.
Good quality management is rarely about adding more indicators.
It is about selecting metrics that explain variation early enough to act.
The next useful step is to map one critical process, define its key variables, and review whether current reports show stability or only output.
From there, compare internal data with supplier, equipment, and material conditions.
That kind of connected review supports more reliable decisions across production, compliance, and supply chain operations.
Related Intelligence